How to Build a Data Platform: The Six Key Components
Six Components, Not One Big System
In my previous post , I talked about why and when a company needs a data platform. In this post, I want to answer the next question: if you decide to build one, what does it actually include?
First of all, a data platform is not a single piece of software. It is a set of tools and services working together. So two data platforms can look very different. A startup with a few engineers and a global company with thousands of employees will make very different choices, because their data volume, budget and security requirements are different. But if we put the specific tools aside, almost every data platform has the same six components.
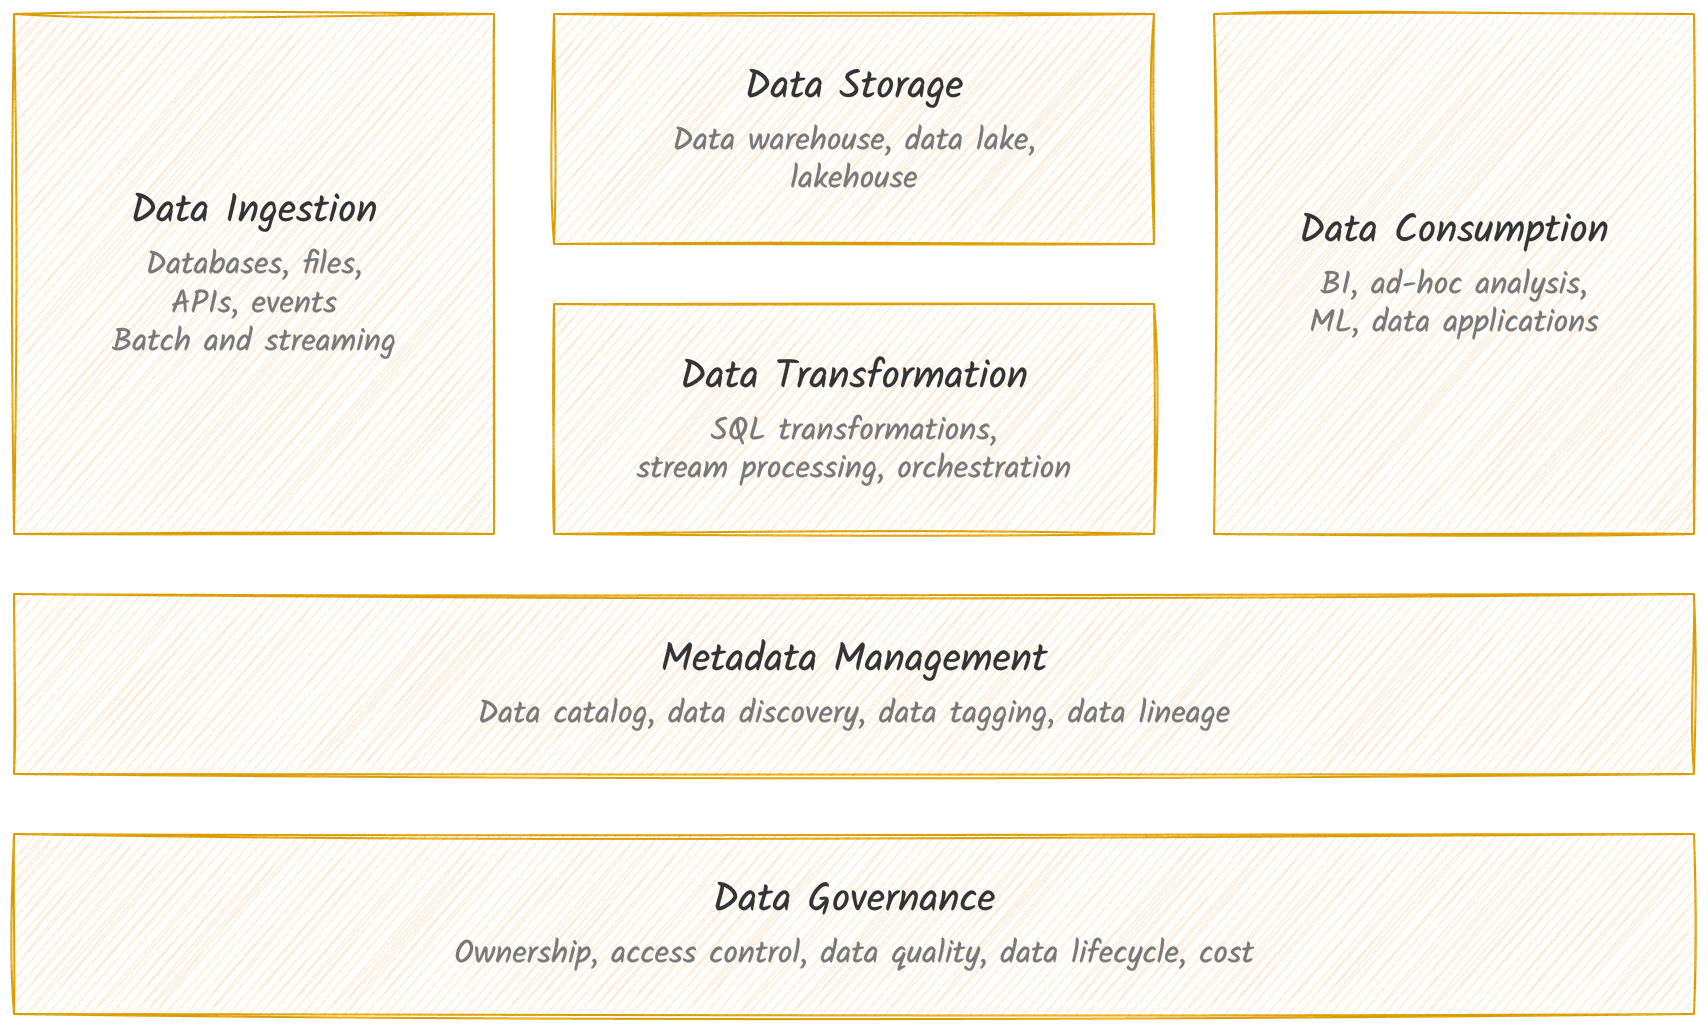
The top row is the path of the data. Data comes in through ingestion, lands in storage, gets cleaned and modeled in transformation, and finally is used by people and systems through consumption. The two layers at the bottom, metadata management and governance, are not steps in the pipeline. They cover the whole platform, and they decide if people can find the data and trust it.
Below, I will go through these components one by one. For each one, I also list a few example tools. They are popular ones, not a full list and not a ranking. Tools change fast, so please choose based on your own needs and what your team already knows.
Data Ingestion
Ingestion is to bring data from different sources into the platform. The sources can be business databases, events from apps and IoT devices, log files, or SaaS tools through their APIs. Usually this is where a data platform starts, because without data coming in, nothing else can work.
The first decision is how the data arrives. Batch data is loaded in chunks on a schedule. Streaming data comes in continuously. Based on this, there are three common designs:
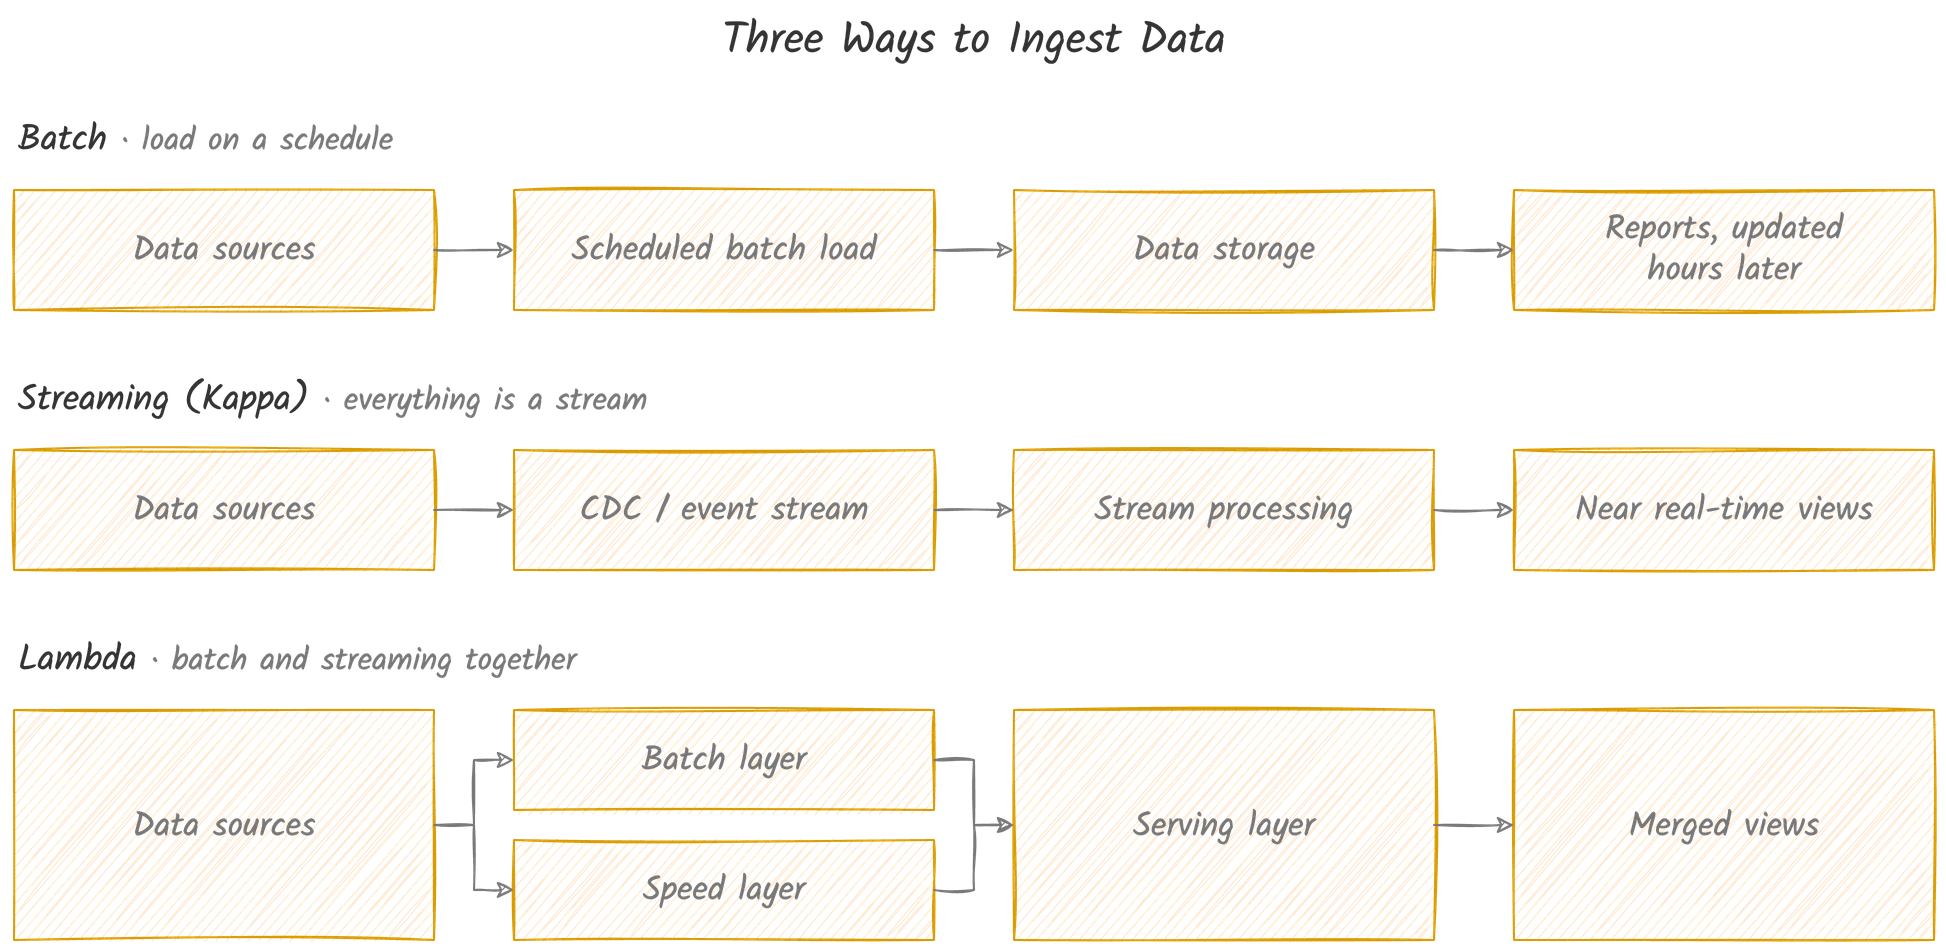
- Batch only. A scheduled job loads the data in batches. If the business only needs yesterday’s numbers, reading the source once a day is enough, even if the source itself produces data in real time.
- Streaming only (Kappa). For example, a CDC (Change Data Capture) tool reads the change log of a database as a stream, and sends every change into the platform. When everything is handled as a stream, including reprocessing old data, it is called the Kappa architecture.
- Both (Lambda). A batch layer reprocesses all the data regularly and gives complete results, but it is slow. A speed layer only handles the newest data that the batch layer has not processed yet. Then a serving layer merges the two. The downside is that you need to write and maintain the same logic twice.
My suggestion is to start with batch. Only add streaming when the business really needs fresh data, for example fraud detection or live operation dashboards. Streaming pipelines are much harder to build, test and debug. To be honest, I have seen more teams suffer from streaming they didn’t need, than from missing streaming they really needed.
The second decision is ETL or ELT. ETL (Extract, Transform, Load) transforms the data before writing it into the platform, so the raw data is usually not kept. ELT loads the raw data into the platform first, and transforms it later. For a modern platform, ELT is usually the better choice, for three reasons. First, different use cases can share the same raw data. Second, when a transformation goes wrong, you can rebuild everything from the raw data. Third, you can find data problems earlier by checking the raw data directly. ELT needs more storage, but storage is cheap today.
Example tools: Fivetran and Airbyte (connectors), Debezium (CDC), Apache Kafka (event streaming).
Data Storage
Storage is where the data lives after it comes in. Today there are three main options:
- Data warehouse. A database built for analysis (OLAP), not for running an application (OLTP). Data is stored in a structured way, and SQL is the main language. Cloud warehouses store data by columns and run queries in parallel on many machines, so they are fast for analytics. Now they also support semi-structured data like JSON quite well.
- Data lake. Files in their original format, stored in cheap object storage (in the past, on HDFS). A data lake can hold almost anything: tables, JSON, logs, documents, images and videos. Engines like Spark read these files, and usually convert them into a columnar format like Parquet for analysis. Data lakes and warehouses are often used together. The lake keeps the raw data, and the warehouse keeps the cleaned results.
- Lakehouse. If you use a lake and a warehouse together, you have two copies of a lot of data. A lakehouse solves this by adding warehouse features directly on top of the files in the lake, using open table formats. These formats give you transactions, schema enforcement, updating or deleting single rows (important for GDPR deletion requests), and time travel. Also, because the data stays in an open format, several engines can read the same tables, so you are less locked into one vendor.
So which one should you choose? If most of your data is structured and mainly used for BI, a cloud warehouse alone is often enough, and it is the simplest to run. If you have a lot of semi-structured or unstructured data, very large volume, or heavy machine learning work, then a lake or lakehouse makes more sense.
No matter which one you choose, I suggest organizing the data in layers:

- Raw: a copy of the source data, kept as it is, so you can always rebuild from it.
- Staging: cleaned and standardized data, for example fixed data types, consistent names and removed duplicates.
- Modeled: where the business logic lives. Most teams I have worked with use dimensional modeling here. That means fact tables for business events like orders, and dimension tables that describe them, like customer and product. It is easy for analysts to understand, and fast to query.
- Serving: summary tables, metrics and APIs built for specific users, so their queries can stay simple and fast.
Example tools: Snowflake and Google BigQuery (data warehouses), Databricks (lakehouse platform), Apache Iceberg and Delta Lake (open table formats).
Data Transformation
Transformation is where raw data becomes useful: cleaning, joining, aggregating and applying business logic. In my opinion, most of the long-term cost of a data platform comes from here, because the transformation logic keeps growing as the business grows. Two things are most important here.
Write business logic in SQL as much as possible. Modern SQL can express most business logic, with window functions, arrays, JSON functions and so on. The biggest benefit is that more people can read it. When there is a data issue, an analyst can read the SQL and help to find the problem. Otherwise, everyone has to wait for the one engineer who wrote a complicated program. Of course, for heavy machine learning feature processing or complex streaming logic, you still need an engine that runs Python, Java or Scala code.
Use a proper orchestration tool. Data jobs depend on each other. For example, this table must be ready before that report runs. An orchestration tool schedules the jobs, manages these dependencies, retries failed jobs and shows what is running. Writing a simple scheduler by yourself looks easy at the beginning, but usually it grows into something much bigger than you expected.
Example tools: dbt (SQL transformations), Apache Spark (batch processing), Apache Flink (stream processing), Apache Airflow and Dagster (orchestration).
Metadata Management
Metadata is data about your data: which tables exist, what each column means, who owns it, where it comes from and how fresh it is. When the platform is small, all of this information is in a few people’s heads. When the platform grows, this becomes a real problem. Actually, in growing companies, one of the most common complaints I hear is not that the data is slow. It is that people cannot find the data they need, or they don’t know which of three similar tables is the right one.
There are two important parts:
- Data catalog. It is like a search engine for your data. People can search for tables, read the descriptions of tables and columns, see who owns them, and check when they were last updated. Tags are also useful. For example, if you tag the columns with personal information, governance rules can be applied to them automatically.
- Data lineage. It shows where each table comes from, and where it goes. When a number on a dashboard looks wrong, lineage tells you which upstream tables to check. Before you change a table, it tells you which downstream tables, reports and teams will be affected. Lineage can be collected automatically with OpenLineage, which is an open standard. Tools like Airflow, Spark, Flink and dbt send an event for each job run, which says which datasets the job read and wrote. Then a backend builds the lineage graph from these events.
Example tools: DataHub and OpenMetadata (data catalogs), Databricks Unity Catalog (catalog built into a platform), OpenLineage (lineage).
Data Governance
Governance sounds like a boring word. But it is actually about making sure the right people can use the right data, they can trust it, and the platform is run in a responsible way. It covers ownership, access control, data lifecycle, cost and data quality.
Ownership. Every important dataset and pipeline should have a clear owner. Usually it is a team, not one person. The owner answers questions about the data, approves changes, agrees on the SLA, and fixes the data when something goes wrong. Please record the owner in the data catalog, so anyone can find who to ask. Tables without an owner are the ones that nobody wants to change or delete, and the number of them keeps growing. When people change teams or leave the company, hand over the ownership on purpose, so it does not get lost.
Access control and security. Encrypt the data in storage and in transit. Give people read access by default, and only let the service accounts of pipelines write to production tables. Expose data through views or curated tables, so you can control which columns and rows each group can see. Know where the personal data is, and mask or restrict it. Also, grant access by groups and roles, not person by person. Otherwise after one year, nobody can tell who has access to what. Tools like Apache Ranger or Databricks Unity Catalog can help to manage these rules in one place.
Data lifecycle. Storage is cheap, but it does not mean we should keep data forever. Decide how long each kind of data should be kept, based on business needs and regulations. Move old data to cheaper storage, and delete the data you no longer need. Also make sure you can delete one person’s data across the whole platform, when a privacy regulation like GDPR requires it.
Cost. In the cloud, the bill of a data platform can easily grow faster than the data itself. Often a small number of things take most of the money, for example a few heavy queries, dashboards that refresh much more often than people look at them, or old pipelines that keep running for tables nobody uses. So the first step is to make the cost visible. Tag compute and queries by team and pipeline, so you know who spends what. Set budgets with alerts, and let compute shut down when it is idle. Showing each team its own cost also helps a lot. Once people can see the numbers, they usually start to optimize by themselves. Besides, check for unused tables, dashboards and pipelines regularly, and turn them off.
Data Quality
If people cannot trust the numbers, nothing else about the platform matters. To be honest, from my experience, data quality decides whether a data team is trusted or not. One wrong number in front of the leadership team can break the trust that took months to build.
What to track. “Good data” is too vague to measure. It is better to break it into several dimensions, and decide which ones are important for each dataset:
| Dimension | Question it answers | Example check |
|---|---|---|
| Freshness | Is the data up to date? | Yesterday’s data is ready by 7 AM |
| Completeness | Is all the data there? | Row count is close to the source, required columns have no nulls, no day or region is missing |
| Accuracy | Do the values match reality? | Total revenue matches the billing system |
| Consistency | Does the same data agree everywhere? | The same metric shows the same number on different dashboards |
| Uniqueness | Is anything counted twice? | The primary key has no duplicates |
Not every dataset needs all the checks. A table behind the CEO’s weekly report needs all of them. A temporary table for one analysis may only need a freshness check.
How to track it.
- Test before publishing. Load new data into a staging table and run the checks. Only move it into production when all checks pass. This is often called the write-audit-publish pattern. Bad data should stop here, instead of showing up on a dashboard silently.
- Monitor over time. A job that succeeded can still produce wrong data. For each important table, track a few numbers like row count, freshness, null rate and totals, and send an alert when they move far away from the normal range. This can catch problems that nobody thought to write a test for.
- Catch problems at the source. Many issues come from upstream, like a renamed column or a field whose meaning has changed. Agree with the teams that produce the data on what the data should look like. Some teams write this down as a data contract, and check it automatically during ingestion.
- Keep alerts meaningful. Decide which failures should stop the pipeline, and which ones should only send a warning. If the team gets hundreds of alerts every day, they will ignore all of them, including the important one.
Set SLAs for important data. An SLA (Service Level Agreement) is a promise to the people who use your data. For example, “the daily orders table is complete for the previous day by 7 AM Eastern time.” With an SLA, everyone has the same clear expectation, so there is no argument about what “on time” means. Only the most important datasets need an SLA, like executive dashboards, regulatory reports and anything customer-facing. The SLA should be specific: which dataset, which dimension, what target, and who owns it. Core upstream tables need stricter SLAs than the reports built on top of them, because everything downstream depends on them. Also, send the alert before the SLA is missed, not after. If a source is late at 5 AM, you want to know it at 5 AM, so there is still time to fix it or to inform people.
When bad data gets through. Even with all these checks, bad data will still get through sometimes. What matters is how you handle it:
- Stop it from spreading. Pause the affected pipeline. If only a few rows are bad, move them into a separate quarantine table, and let the rest go through.
- Inform the people who use it. Use lineage to find the affected tables, dashboards and teams. Tell them what is wrong and when you expect to fix it. It is much better that they hear it from you, than they find it by themselves in a meeting.
- Fix the root cause. Often the root cause is upstream, so you may need to work with the team that owns the source.
- Repair the data. Rerun the jobs for the affected period from the raw data. This only works well if every job gives the same result when you run it again, so design the jobs in this way from the beginning.
- Prevent it next time. Add a check that can catch this problem in the future.
When you are not sure, it is usually better to hold the data and tell people it is late, than to publish numbers that might be wrong. People can wait a few hours for a report, but a decision made on wrong numbers is very hard to undo.
Example tools: Great Expectations, Soda and dbt tests (data quality checks), Monte Carlo (data observability).
Data Consumption
Consumption is where the platform finally creates value. All the work in the other components is only useful when people and systems can really use the data. The common ways to use data are BI dashboards and reports, ad-hoc SQL and notebooks for analysts and data scientists, machine learning, data applications and APIs (like analytics features in your product, or data delivered to clients), and sending data back into business tools like the CRM, which is often called reverse ETL.
Two things can make consumption much smoother:
- Define key metrics once. Put the definitions of important metrics, like revenue or active users, in one shared place, such as the serving layer or a semantic layer. Then let every dashboard use the same definitions. This is how you avoid two teams showing two different numbers in the same meeting.
- Make data easy to reach. If data only exists in log files, or in a folder that nobody can query, it is almost the same as having no data. Every important dataset should be reachable with a simple query, from one place. Sometimes a federated query engine, which can query several sources in one SQL statement, is easier than copying everything into one system.
Example tools: Tableau, Looker and Apache Superset (BI).
Where to Start
After reading about these six components, you may think it is a lot of work. Yes, it is. But you don’t need to build all of them at the beginning, and I don’t recommend it either.
From my experience, a good first version only needs the top row. Ingest the most important sources, store them in a cloud warehouse or data lake with a raw layer and a modeled layer, transform them with SQL on a proper orchestration tool, and put a BI tool on top. Even at this stage, please add basic data quality checks and access control, because they are much harder to add later.
Then, as more teams start to use the platform, add the other parts step by step. Add a data catalog when people cannot find data anymore. Add lineage when changes start to break things downstream. Add SLAs when other teams start to depend on your data. And add more governance when regulations or audits require it. Let the real problems tell you what to build next.
Wrapping Up
A data platform is not one product that you can buy. It is six components working together: ingestion, storage, transformation, metadata management, governance and consumption. The tools for each component change every few years, but the ideas behind them don’t change much: keep the raw data, model it clearly, check the data before people see it, and make it easy for people to find and use.
If you are still not sure whether your company needs a data platform, you can read my previous post first.